iOS app marketing has a strange shape in 2026: the most expensive channel and the cheapest one are both growing fast, and most teams misjudge the balance between them. Global app user-acquisition spend hit roughly $78 billion in 2025 — up 13% year over year and driven almost entirely by iOS, which surged 35% (Business of Apps, 2026; AppsFlyer, 2026). Yet about 41% of installs still begin with a store search nobody paid for (Digital Applied, 2026).
With more than half a million new apps added to the App Store in 2025 and iOS cost per install above $2.50, you can't buy your way to growth alone — and you can't ignore paid either. This is the complete 2026 iOS app marketing map: every channel, what it actually costs, what moves installs, and the order to build them in.
Key Takeaways
- iOS marketing is a blend, not one channel. About 41% of installs start with a store search, making ASO the compounding, zero-marginal-cost foundation (Digital Applied, 2026).
- The product page is the shared bottleneck every channel funnels through — so creative and ratings are multipliers on your entire spend, not a side project.
- Apple Search Ads converts unusually well (~67%) but costs ~$1.80–$2.51 per install — fix conversion before you scale it (Business of Apps, 2026).
- App Tracking Transparency (15–30% opt-in) blunted paid-social targeting, raising the value of intent channels and first-party lifecycle marketing.
- Retention decides whether any of it pays off — Day 30 retention averages ~5–7%, so acquisition without retention is a leaking bucket.
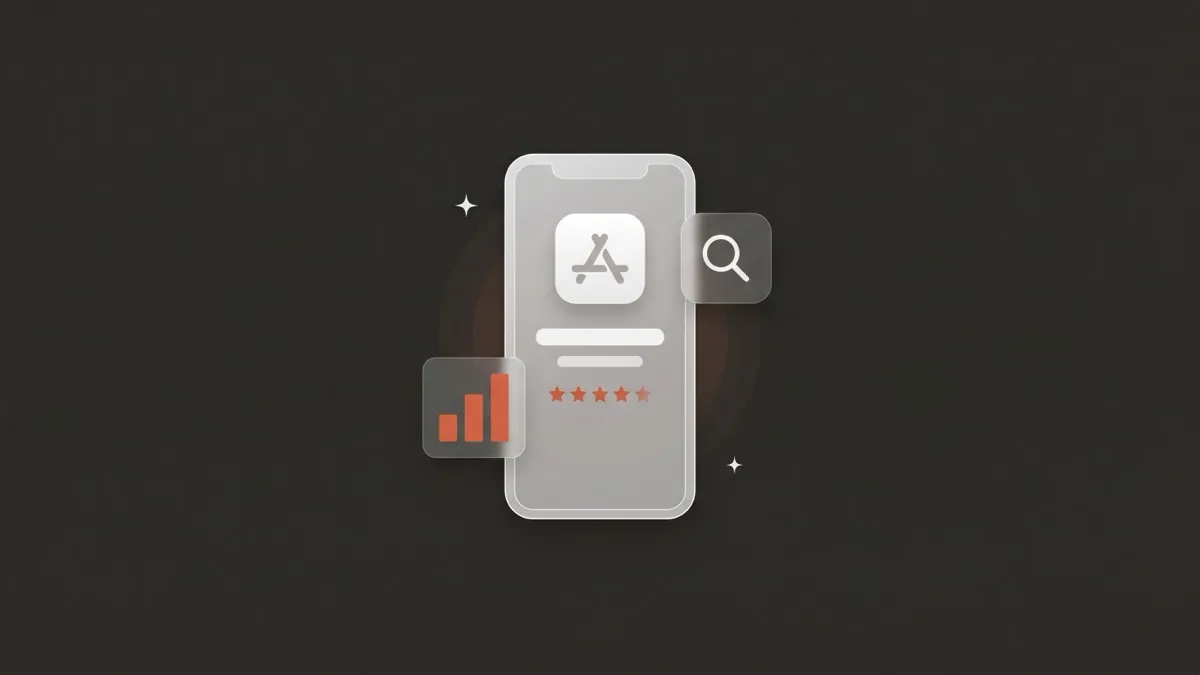
What does iOS app marketing actually include in 2026?
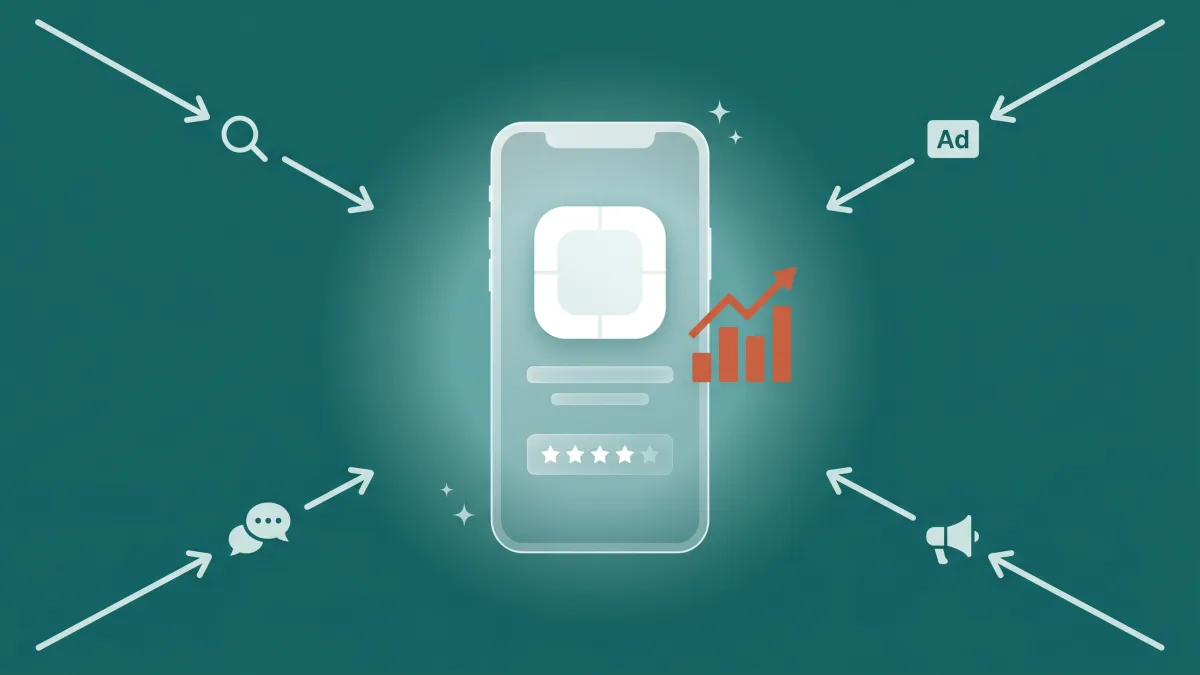
iOS app marketing is the blend of channels that turn awareness into installs and installs into retained users — and in 2026 the install map is unusually clear. Roughly 41% of installs come from store search, 28% from referral (paid user acquisition, web links, QR codes), 18% from browse and recommendations like the Today tab and featured collections, 9% from app clips, and 4% from direct or shared URLs (Digital Applied, 2026). No single channel owns growth.
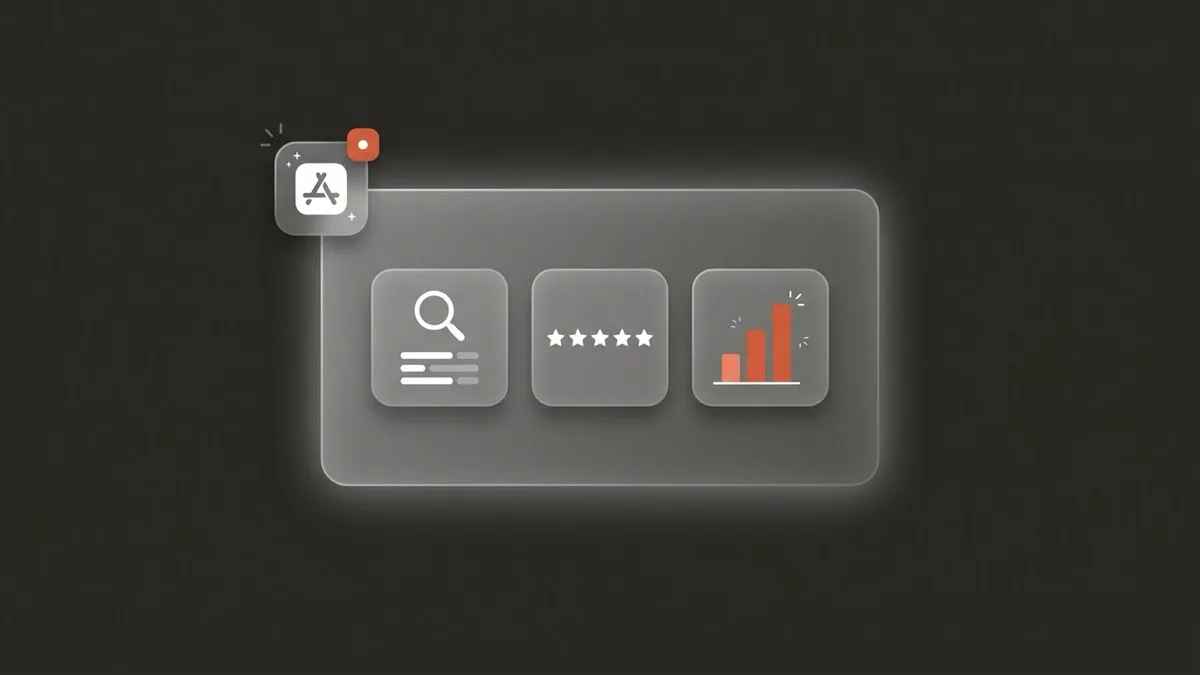
Those channels fall into three pillars: organic (App Store Optimization), paid (Apple Search Ads plus social and other user-acquisition), and earned (press, influencers, word of mouth, and the ratings that flow from a good product). What makes iOS distinct from generic "mobile marketing" is the surface they all share — the product page in App Store Connect — and the constraints around it: App Tracking Transparency, Custom Product Pages, and an algorithm Apple has published guidance on. Whatever channel sends a visitor, they land on the same listing, and that listing decides how many of them install.
Where iOS installs come from (2026)
The practical takeaway: you don't have one marketing problem, you have a portfolio — and the listing every channel routes through is the one asset that lifts or sinks all of them at once. That's why the smartest first move is rarely a new channel. It's the store page itself, which a free ASO and channel-mix audit is built to score.
Why is ASO the foundation of iOS app marketing?
Because store search is both the largest install channel and the cheapest. Roughly 41% of installs start with a search, and store-search traffic converts higher than paid — around 32% on iOS versus about 21% for paid referral (Digital Applied, 2026). App Store Optimization delivers compounding, zero-marginal-cost installs: every keyword you rank for keeps working after you stop spending, while every paid install resets to zero the moment the budget does.
On iOS, ASO comes down to three fields Apple actually indexes: the app name, the subtitle, and the 100-character keyword field. Spend them deliberately — don't repeat words across them, because Apple already combines all three, and a duplicate wastes a slot. The discipline matters because the store is crowded: with over 500,000 apps added in 2025, the apps that get found are the ones with a clean keyword strategy, not the ones with the biggest budget. For how to spend your most valuable field, see the title and subtitle that frame your listing, and for the broader algorithm, what actually drives store-search visibility.
ASO and paid also feed each other. Paid installs can lift your organic rank by manufacturing download velocity — but only if the page converts the traffic you send it. Pour paid users onto a weak listing and you get the cost without the compounding. That feedback loop is why we treat ASO as the floor every other channel stands on, and why the right ASO tools earn their keep: they tell you which keywords are worth ranking for before you spend a dollar acquiring traffic for them.
When should you use Apple Search Ads, and what does it cost?
Apple Search Ads is the most intent-driven paid channel on iOS — you're paying to appear for searches users already type — and it converts unusually well, with a platform-wide average conversion rate around 67% (Business of Apps, 2026). But it isn't cheap. The global median cost per install runs about $1.80, climbing to roughly $2.51 in the US, and a retained user — one who's still active later — costs closer to $4.20 (Business of Apps, 2026; AppTweak, 2026).
Use Apple Search Ads for three jobs: defend your brand term so competitors can't bid in front of it, capture high-intent category keywords you don't yet rank for organically, and manufacture velocity at launch when your organic rank is still cold. But there's one rule that separates profitable spend from waste — only scale Apple Search Ads once your product page already converts at or above your category benchmark. Route campaigns to a matching Custom Product Page so the creative matches the search, and read per-keyword conversion in the dashboard. Pay premium iOS prices to fill a leaky bucket and the math never works.
What an iOS install costs, by source (USD)
How did App Tracking Transparency change iOS marketing?
It rewired paid acquisition. Since App Tracking Transparency launched, only about 15–30% of users opt in to cross-app tracking (Business of Apps, 2026). That single change gutted the granular audience targeting and deterministic attribution that Meta and other paid-social channels relied on. The practical result is that broad paid user acquisition on iOS is blunter and harder to measure than it was before 2021 — you're working with modeled, aggregated data rather than user-level signals.
That shift has a clear strategic consequence: it raises the relative value of channels ATT didn't touch. Intent-based channels — Apple Search Ads and ASO — still reach people at the moment they're looking, no tracking required. And first-party lifecycle channels you own outright — onboarding, push notifications, email — became more valuable precisely because they don't depend on cross-app identifiers. If you ship on Android too, the privacy model diverges sharply there; how iOS and Google Play differ covers which tactics transfer and which don't.
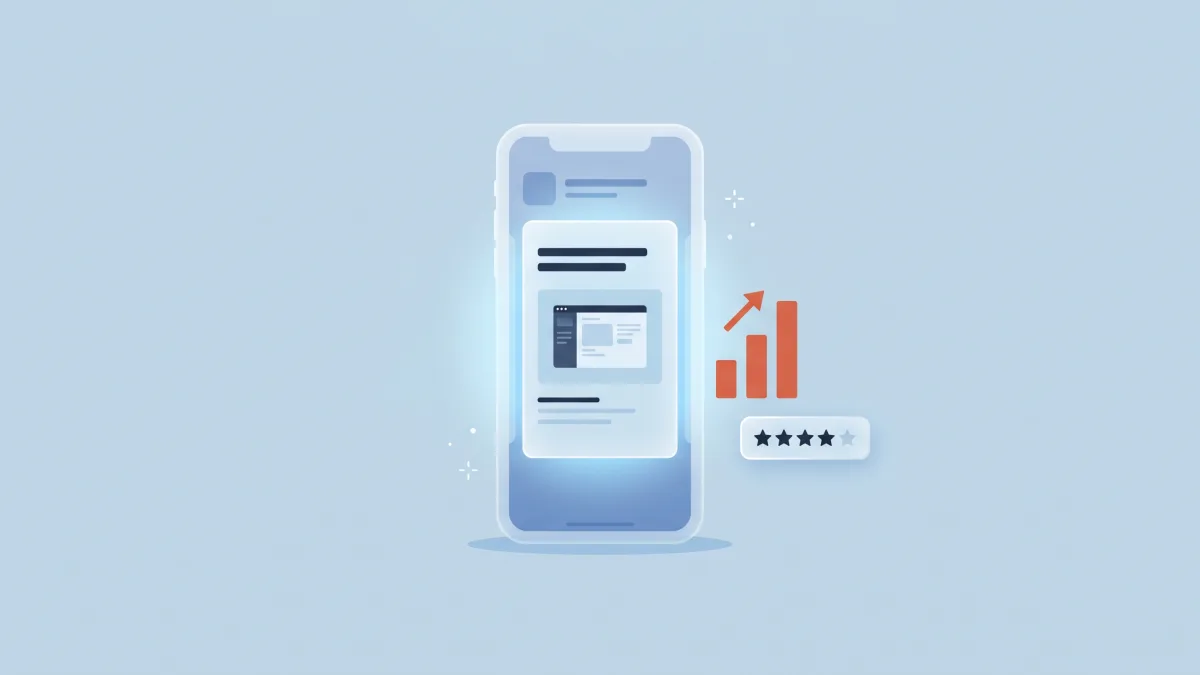
How much do creative and ratings decide your install rate?
They decide whether any of your traffic converts at all. Apple's own product page guidance shows the first three screenshots drive roughly 60% of the install decision, and moving from a 3-star to a 4-star rating can lift install conversion by about 89% (Apple Developer, 2026; Digital Applied, 2026). Because every channel — search, ads, social, press — funnels onto the same product page, creative and ratings are multipliers on your entire marketing budget, not a side project you get to later.
The mechanics are consistent. Lead the first screenshot with an outcome, not a feature; stack a short, high-contrast caption at the top of the frame; and reserve a preview video for the categories where it helps — it lifts conversion in Games and Social but can hurt Finance and Productivity by adding friction. Ratings sit right beside your first screenshot, so the 4.0-star threshold quietly taxes every other improvement while you're below it. The full mechanics live in the conversion-rate playbook and the guide to App Store ratings and reviews — but the headline is simple: a page that converts 30% buys twice the growth from the same spend as a page that converts 15%.
iOS marketing is a funnel of funnels, and the product page is the one every channel pours into. Paid UA, Apple Search Ads, social, influencer, and PR all dump traffic onto the same listing — so if that page leaks, every channel's cost per install inflates together. The highest-leverage "marketing" work, then, often isn't a new channel at all. It's fixing the floor the entire portfolio stands on. Optimize the listing first; only then is it worth opening new taps above it.
How do you market an iOS app launch and pre-launch?
The launch starts before the app is live. An effective pre-launch builds a waitlist, lines up press, and collects real feedback, so day one has momentum instead of silence — which matters because download velocity in the first days feeds your store ranking. About 18% of iOS installs come from browse and recommendations like the Today tab and featured collections (Digital Applied, 2026), and that earned-discovery channel rewards apps that launch with a clear story and early traction. For the week-by-week version, see our app pre-launch marketing playbook.
Sequence it: a pre-launch landing page and waitlist, a TestFlight beta to surface bugs and gather early ratings, and an App Store pre-order to bank installs for launch day. Then concentrate your owned channels — email list, social following, relevant communities — into a single launch-day push, and use Apple Search Ads to manufacture the early velocity that organic ASO needs to start compounding. Getting featured is its own discipline; how to get your app featured on the App Store covers the criteria Apple's editors actually score. A launch without ASO foundations underneath it wastes the spike — the traffic arrives, ranks briefly, and fades because nothing was built to hold it.
Why does retention decide whether marketing pays off?
Because acquisition without retention is a leaking bucket you keep refilling at $2.50-plus a pour. Across all categories, average Day 1 retention sits near 25% and Day 30 near 5–7% — the typical app keeps fewer than one in four users past the first day, and only about one in twenty by day 30 (UXCam, 2026). iOS retains slightly better than Android, around 27% on Day 1, but the curve is steep everywhere. Spending to acquire users who churn in a week is the most expensive mistake in the playbook.
The highest-leverage fix is first-session activation: apps that get a user to their first real "aha" moment retain at two to three times the rate of apps that don't, regardless of category (UXCam, 2026). And the channels that drive activation and retention — onboarding, push, email, in-app messaging — are first-party, so ATT never touched them. Retention also closes the loop back into acquisition: active, engaged users are a behavioral signal that feeds your store ranking, so the work that keeps users is the same work that lowers your cost to get the next ones. Localized onboarding compounds this in new markets, which is where localization earns its place in the stack.
Mobile app retention curve: average vs. strong activation
What's the right iOS marketing stack, and where do you start?
Build in order of compounding leverage. ASO comes first because it's the floor and the cheapest channel. Then product-page conversion optimization, so every channel that follows actually converts. Then Apple Search Ads, to capture intent and manufacture launch velocity. Then paid social, influencer, and press for reach. And underneath all of it, lifecycle and retention work that protects the users the channels above bring in. The one discipline that ties it together: don't scale paid acquisition until your page converts at or above your category benchmark, because rising iOS costs per install only multiply your losses on a listing that leaks.
| Channel | Role in the stack | Typical cost | Turn it on when… |
|---|---|---|---|
| ASO (organic search) | Foundation — compounding, found at the moment of intent | ≈ $0 per install at the margin | First, before anything else |
| Conversion (CRO) | Multiplier — converts the traffic every other channel sends | Design & testing time | As soon as the listing gets traffic |
| Apple Search Ads | Intent capture + launch velocity | ≈ $1.80–$2.51 per install | Once the page converts to benchmark |
| Paid social & influencer | Reach and awareness (blunter post-ATT) | Varies; modeled attribution | After Apple Search Ads, to scale |
| PR & featuring | Earned discovery (Today tab, press) | Outreach time | Around launch and milestones |
| Lifecycle & retention | Keeps the users the channels above acquire (first-party) | Low; channels you already own | Always-on, underneath everything |
If you're working with no budget, the same order still holds — you just lean on the free rungs: ASO, sharp screenshots, ratings prompts, communities, and content, all of which feed the 41% of installs that come from search. If you'd rather have someone map your current channel mix, score your listing, and tell you which lever is leaking installs before you spend another dollar, that's exactly what a free audit is for. Either way, the sequence beats the scramble: fix the floor, then raise the ceiling.
Frequently asked questions
How do I market an iOS app in 2026?
Blend channels in order of leverage: ASO first (about 41% of installs start with a store search), then product-page conversion optimization, then Apple Search Ads, then paid social and earned channels, with retention underneath (Digital Applied, 2026). Fix the store listing before scaling paid.
Is ASO or Apple Search Ads better for iOS?
They work together. ASO delivers compounding, zero-cost installs and converts higher (~32% on iOS); Apple Search Ads captures high-intent demand fast (~67% conversion) but costs ~$1.80–$2.51 per install (Business of Apps, 2026). Start with ASO, then layer Apple Search Ads.
How much does it cost to market an iOS app?
Paid installs run a global median cost per install of ~$1.80 (US ~$2.51), and a retained user costs ~$4.20 — while organic ASO installs cost effectively nothing at the margin (Business of Apps, 2026). A strong organic foundation keeps blended acquisition cost down as paid prices rise.
Did App Tracking Transparency kill iOS app marketing?
No, it shifted it. With only ~15–30% of users opting in, granular paid-social targeting weakened, making intent channels (ASO, Apple Search Ads) and first-party lifecycle marketing more valuable (Business of Apps, 2026).
How do I market an iOS app with no budget?
Lean on the free, compounding channels: ASO (name, subtitle, keyword field), strong screenshots, ratings prompts, relevant communities, and content. Store search drives ~41% of installs and costs nothing but effort (Digital Applied, 2026).
The bottom line
iOS app marketing in 2026 isn't a single channel you can win — it's a portfolio you sequence. The map is consistent, and so is the order of operations:
- Treat it as a blend: about 41% of installs start with store search, so ASO is the compounding, zero-marginal-cost foundation.
- Remember the product page is the shared bottleneck — creative and ratings multiply every channel's spend at once.
- Use Apple Search Ads for intent and velocity, but only after the page converts; at ~$1.80–$2.51 per install, a leaky page wastes premium prices.
- Lean into the channels ATT didn't break — intent search and first-party lifecycle marketing — now that paid-social targeting is blunter.
- Build the stack in order: ASO → conversion → Apple Search Ads → reach → retention, because retention (Day 30 ~5–7%) decides whether any of it pays off.